Phase One Overview
The first phase of the Pilgrim Hot Springs Project consists of airborne and satellite mapping of the geothermal anomaly. The FLIR (forward looking infrared) airborne survey technique has been successfully used at Chena Hot Springs in Alaska, to measure heat loss which correlated closely with values calculated from conductive thermal gradient hole data and convective output. If a FLIR survey coupled with a new iterative digital processing method can be repeatedly shown effective at estimating the heat flow to the surface for systems with a discrete surface expression, this will provide a very low cost and fast method of measuring the natural heat loss of a geothermal system which can be an indication of its maximum possible electrical megawatt output. This Phase has been divided into the following sub-tasks.
Task 1
Task 1.1: Satellite-Based Geothermal Anomaly Mapping.
This task is intended to outline the shallow thermal anomaly and calculate the heat flux by utilizing existing Landsat and Aster images with a new iterative digital processing method that is anticipated to drastically reduce the number of false alarms and uncertainties associated with traditional thermal infrared data processing. This processing scheme involves first categorizing thermal data based on ancillary information, such as elevation, slope, aspect, land cover, geologic and geophysical signature, then processing each category separately using a first derivative filtering process. This will allow us to identify consistently anomalous pixels before using image stacking to differentiate the most promising geothermal anomalies from false alarms. For each thermally anomalous area we will calculate the kinetic temperature using the inverse Planck’s function and will estimate the thermal flux in watts/unit area/unit time. Processed subsets will then be mosaiced back to generate a thermal anomaly map of the area.
Status and Results
Processing and analysis of Landsat 7 Enhanced Thematic Mapper (ETM+) thermal imagery acquired over the region of Pilgrim Hot Springs (PHS) was used to delineate geothermal anomalies with a view to planning the airborne thermal infrared (FLIR) and optical survey. A search of the entire Landsat 7 archive for ETM+ images from the PHS region yielded 18 scenes, which had been acquired between August 1999 and July 2010. We selected a subset of eleven datasets for further analysis corresponding to cloud and snow free images.
Processing of the ETM+ data was applied to the low-gain thermal band (band 6L) that records thermal infrared radiation in the 10.40-12.50 µm wavelength region at a ground spatial resolution of 60 m. The discrimination of thermal anomalies was undertaken using the image ‘stacking’ approach described by Prakash et al. (2011) [1]. This included pre-processing the band 6L thermal data for each dataset using the three-step procedure described by Chander et al. (2009) [2] that involved:
Figure 1 – Location of thermal anomalies detected from Landsat 7 ETM+ data
for the area near Pilgrim Hot Springs; thermal anomalies (colored polygons) are
overlain onto a topographic map of the area. The map indicates several persistent
thermal anomalies aligned in an N-S band located west of the main PHS site.

- applying sensor gain and offset values to convert the sensor digital numbers (DNs) to measured at-sensor radiance values,
- converting the at-sensor radiance values to brightness temperature using a modified Planck equation, and
- calculating kinetic temperature from brightness temperature using a fixed emissivity value of 0.96.
For each pre-processed band 6L dataset we produced a thermal hotspot image representing the highest temperature values using a threshold determined from the top 10% of the thermal image histogram.
We integrated the thermal hot spot images for each year to identify temporally persistent thermal anomalies that may represent geothermal sources (Figure 1): if a thermally anomalous pixel was identified in data from three different years then it was labeled as a persistent anomaly.
The results of analysis of the ETM+ data highlight five main persistent thermal anomalies located within the broad region of the Pilgrim Hot Springs. Four thermal anomalies appear to be form a broad 5 km swath aligned in an N-S direction located around 1 km west of the main PHS site (Figure 1). A fifth spatially extensive thermal anomaly was mapped towards the western end of Hen and Chickens mountain (Figure 2). We consider that the three thermal anomalies detected south of the Pilgrim River (Figure 1) represent the best candidates for geothermal anomalies. The two hot spots detected north of the Pilgrim River are somewhat large and associated with bare soil and rock exposure that may indicate solar heating effects rather than a geothermal source.
In support of the proposed second airborne FLIR survey (Task 1.2) we will analyze ASTER (Advanced Spaceborne Thermal Emission and Reflection radiometer) thermal infrared data acquired over the PHS site with the aim of identifying geothermal anomalies. Although the 90m spatial resolution of the ASTER thermal bands is lower than that of Landsat 7, ASTER is a multispectral instrument and is routinely used to acquire data during its nighttime ascending orbit. Nighttime thermal data is particularly useful as it will enable the minimization of the effects of solar heating, which provide impediments to the detection of subtle geothermal anomalies. The five ASTER thermal bands will also enable the effects of emissivity to be accounted for within geothermal anomaly detection.
Task 1.2 Airborne FLIR Surveys.
Two FLIR surveys will be flown over 16 square miles surrounding the hot springs in the spring and fall to perform a more detailed assessment of the thermal anomaly and its heat loss. This will incorporate a small thaw in the permafrost about 3.2 km NE of Pilgrim Hot Springs. The iterative digital processing method described in Task 1.1 will also be used to process the resulting data.
Status and Results
Airborne Survey

Figure 2 – Landsat 7 satellite images of Pilgrim Hot Springs region.
Left: extents of primary and secondary survey areas; thermal anomalies
detected from Landsat 7 satellite data are indicated by red filled polygons.
Right: flight lines (red) for the aerial survey over Pilgrim Hot Springs;
cloud and turbulence restricted data acquisition over the southern half
of the secondary survey area.
We planned the airborne data acquisition around high and low priority survey areas (Figure 2) to provide flexibility in case of poor weather conditions. The primary survey area covered a ~27 km2 square region centered on the main PHS site encompassing the most likely geothermal anomalies detected from the Landsat 7 ETM+ data (red polygons in Figure 2). The secondary lower priority area covered a larger ~175 km2 area including the sites of the other thermal anomalies detected from Landsat. The airborne survey was undertaken from 9-15th September 2010 using the airport at Nome (~70 km south of PHS) as the base for flight operations. There were favorable weather conditions over the study area during the period of the airborne survey that enabled acquisition of data over the entire primary survey area and the northern portion of the secondary survey area (Figure 3).

Figure 3 – Field calibration and validation data sites for the primary target area of the Pilgrim Hot Springs survey; the data is overlain onto a high resolution color-near infrared aerial photograph (AHAP) of the study area.
Imaging of the southern portion of the secondary area was not possible owing to persistent cloud cover and turbulence over the northern part of the Kigluaik Mountains. FLIR images were successfully acquired along all the flight lines indicated in Figure 2. Optical imagery was acquired for most of the flight lines however, there were technical issues that mean there are some gaps in the image coverage from the north of the secondary survey area. As our main aim was to acquire FLIR images for the primary survey area we consider that the airborne survey was successful.
Preliminary processing and analysis of airborne survey data
Figure 4 – Mosaicked FLIR surface temperature data for the main
Pilgrim Hot Springs site (bottom left) and possible geothermal
area to the north-east (top right).

We have undertaken a preliminary analysis of two subsets of the FLIR data from the region around the main hot springs site and for an area ~3.5 km north-east along the Pilgrim River where field observations provide some evidence for a geothermal anomaly (Figure 4). The results from this work formed the basis of a presentation at the AGU Fall Meeting 2010 (Haselwimmer et al., 2010) [3].
Pre-processing of the FLIR data involved calculation of surface temperature values (within ThermaCam Researcher software) using the in-situ measurements of temperature and humidity, and average flying height to correct for atmospheric effects (absorption and emission).
Figure 5 – Comparison of FLIR derived surface temperatures (black line)
with a field temperature profile (red line): the comparison is for the profile
across line A-B on Figure 6.
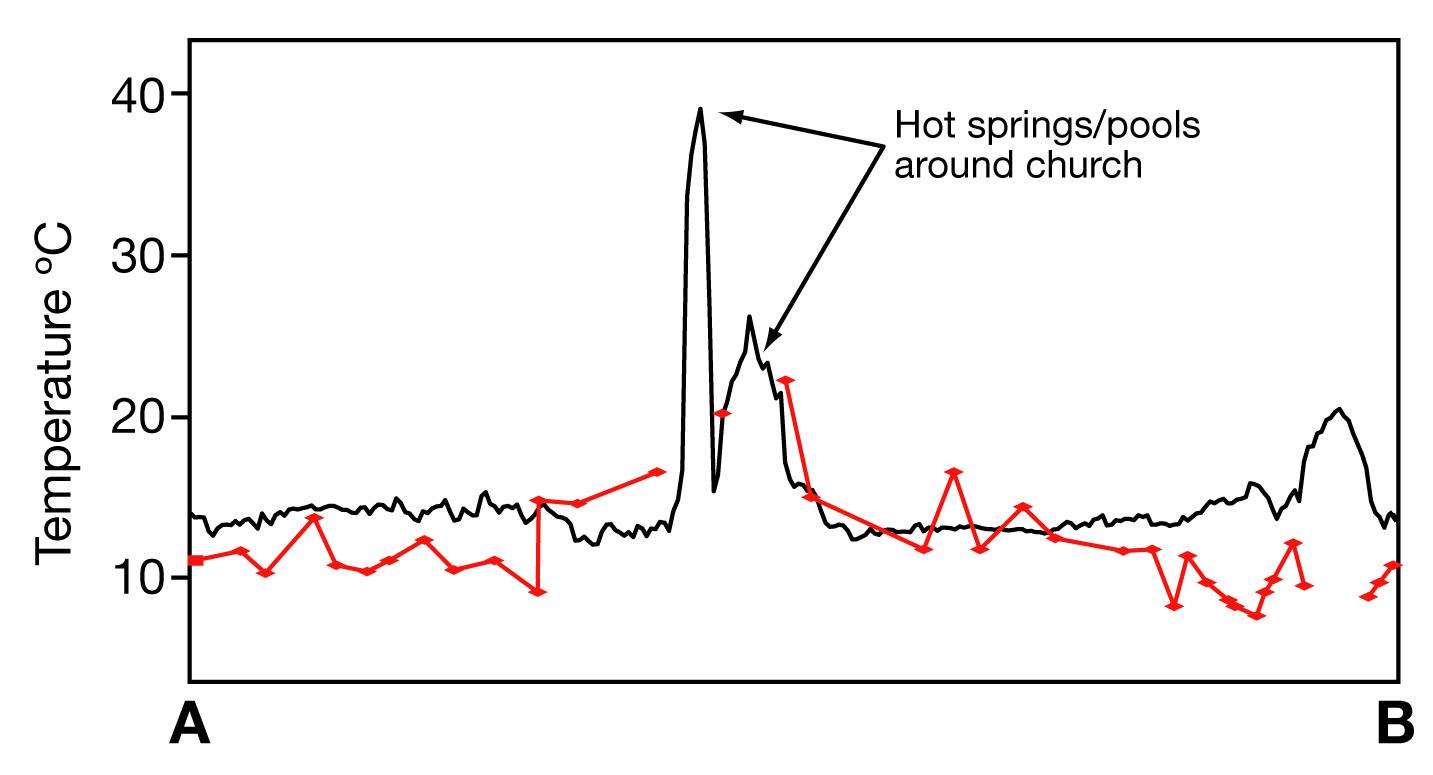
Comparison of retrieved surface temperature values with the ground based temperature profiles show reasonable agreement (Figure 5). For our preliminary analysis we did not attempt to adjust the FLIR data using the field measurements but this is something that will be undertaken for future analyses.
Our preliminary analysis of the FLIR surface temperature data from the main PHS site (Figure 6) has enabled the clear delineation of the surface features (natural and manmade) associated with the geothermal system such as hot springs, wells, pools, and areas of hot ground. The surface temperatures of these features, integrated over the 1.3 m pixel size of the FLIR sensor, ranges up to 40.5°C. The FLIR results delineate geothermal features that may be difficult to map on the ground such as:
Figure 6 – FLIR (left) and optical (right) data from the main Pilgrim Hot Springs site.
The FLIR data effectively delineates surface features associated with the
geothermal system such as hot springs, pools and warm ground.

- upwelling hot springs within pools of water;
- temperature gradients within pools and streams indicating the dispersion and equilibration in temperature of hot and cool waters;
- subtle geothermal features, that may represent previously unmapped small springs or areas of hot ground away from the main spring complex.
Our analysis of the FLIR data from the area NE of the main PHS site (Figure 4) provides little evidence for current geothermal activity. The range of surface temperatures is consistent with the different surface types (vegetation, soil, water ponds) and there are no obvious thermal anomalies that could be related to geothermal activity. One small thermal anomaly from the west of that area may warrant further field-based investigation to establish whether this is related to geothermal activity.
The second airborne FLIR acquisition was flown in April 2011. The purpose of this flight was to acquire secondary thermal measurements over the main Pilgrim Hot Springs site to validate initial thermal flux calculations as well as investigate thermal anomalies detected from the analysis of the FLIR data from September. For the analysis the image mosaicing was made semi-automated. We determined the geographic location of each image using the in-flight GPS information that was time synced with the images obtained from the optical and FLIR sensor systems. For automated mosaicing we used the 2D3 software package.
Additional task 1 data, images and maps are available here.
Task 2
Task 2.1 Conduct a Shallow Temperature Survey.
Preliminary review of existing data and airborne imagery of potential thermal anomalies observed from early fall snow melt patterns and ground based magnetic data collected by the USGS in April 2010 suggests the geothermal aquifer may lie along a trend extending from the springs to the northeast. To verify this trend and select targets for Task 3 drilling, holes 5-10 m deep will be installed over the entire possible shallow thermal anomaly. These holes will be installed by hand with a portable drill by a field crew travelling on foot and will not utilize any drilling mud or sumps. These will also be useful in independently estimating the conductive heat loss from the geothermal field.
Status and Results
Backpack drilling program
Preliminary shallow data was collected and geo-referenced during the 2010 field season, and two additional surveys were conducted in April 2011. An attempt was made to utilize a backpack drill obtained from Shaw Tool Ltd and primarily used for mineral exploration and sampling. The goal was to reach greater depths and cover a larger area to better delineate the shallow thermal anomaly and define its margins. A total of 31 holes were drilled to depths of up to 10ft while the area was still snow covered and could be readily accessed by snowmobile. However, a number of challenges arose including holes collapsing before tubing could be installed, and snow up to 6ft deep. These challenges limited our ability to install as many holes as planned or achieve a uniform depth in drilling these holes, which presents some difficulty with interpretation.
GeoProbe program
We acquired additional (shallow) temperature data through use of a track mounted Geoprobe system during the 2011 and 2012 field seasons. The Geoprobe is a small unit (~5,000 lbs) that drives casing into the ground without the need for circulatory fluids. Therefore, no fluid or solid wastes were generated during the hole installation process. In 2011 sixteen GeoProbe holes with an outer pipe diameter of 2.25" and hole diameter of 1.5" were installed to a maximum depth of 109ft. In 2012 additional smaller pipes (1.25in outer diameter; 0.5" inner diameter) were utilized in 54 holes which have increased penetration to as deep as 154 ft. We used the GeoProbe only on established trails in order to minimize surface disturbance. The GeoProbe has a small footprint, with almost no noticeable surface damage where we drilled other than some flattened grass. We properly decommissioned all of these holes prior the end of the 2012 season, by pulling the pipe and sealing the hole with grout as the pipe is removed.
Task 2.2 Geophysical Surveys.
A combination of ground based and airborne geophysical surveys will be conducted to map subsurface hydrothermal fluid flow and identify key structures controlling the flow.
- Sub-Task 2.2a Airborne Geophysical Survey
A high-resolution airborne geophysical survey will be conducted, including the immediate survey area and extending to the northeast to provide a regional geophysical context for the site and to map key structures controlling hydrothermal fluid flow. This sub-task is being completed in conjunction with and partially funded through the United States Geological Survey (USGS).
- Sub-Task 2.2b Ground-based Resistivity Survey
A CSAMT/AMT survey will be run over the entire shallow thermal anomaly to assist in defining its margins and help locate the upflow of thermal water feeding the shallow aquifer. This will extend previous results from over the entire thermal anomaly and the locations of these lines will be recorded by GPS. This sub-task will be funded entirely through match funding through the State of Alaska.
Status
In collaboration with USGS, ACEP conducted a high-resolution airborne magnetic and EM survey in 2011 to provide the regional geophysical framework of the area and help delineate key structures controlling hydrothermal fluid flow and to characterize the basin geometry and depth to bedrock.
The ground MT survey was conducted during the 2012 field season.
List of selected publications and presentations
- Project Update presentation - October 2012
- Geothermal Power for Nome: Update on Pilgrim Hot Springs - September 2012
- Phase I report - September 2012
APPENDIX C:
- Haselwimmer, C., Prakash, A., and Holdmann, G., Estimating convective heat flux and discharge rate of geothermal waters at Pilgrim Hot Springs, Alaska using airborne thermal imaging. Journal of Volcanology and Geothermal Research (in preparation).
- Haselwimmer, C., and Prakash, A., 2012, Chapter 17 - Thermal infrared remote sensing of geothermal systems. in Thermal Remote Sensing, edited by Kuenzer, C., Springer and Praxis, ~500 p. (accepted for publication).
- Haselwimmer, C., Daanen, R., and Prakash, A., 2012, Remote sensing and modeling of anomalous snowpack associated with areas of geothermally-heated ground as a tool for geothermal exploration and resource assessment in cold environments (white paper).
- Daanen, R., Chittambakkam, A., Haselwimmer, C., Prakash, A., Mager, M., and Holdmann, G., 2012, Use of COMSOL Multiphysics to Develop a Shallow Preliminary Conceptual Model for Geothermal Exploration at Pilgrim Hot Springs, Alaska. Geothermal Resource Council, 36th Annual Meeting, Sept 30 - Oct 1, Reno, Nevada. Full manuscript.
- Haselwimmer, C., and Prakash, A., 2011, Use of airborne thermal imaging to quantify heat flux and flow rate of surface geothermal fluids at Pilgrim Hot Springs, Alaska. Trans. AGU 92(52), Fall Meet. Suppl., Abstract no. H51C-1223.
- Haselwimmer, C., Prakash, A., and Holdmann, G., 2011, Geothermal Exploration in Pilgrim, Alaska Using Airborne Thermal Infrared Remote Sensing. Geothermal Resource Council, 35th Annual Meeting, Oct 23-26, San Diego, California. Full manuscript.
- Haselwimmer, C., and Prakash, A., 2011, Potential of HyspIRI for geothermal exploration in high northern latitudes. 4th HyspIRI Science Workshop, August 22-25, Washington D.C. Presentation accessible at http://hyspiri.jpl.nasa.gov/documents/2011-workshop.
- Prakash, A., Haselwimmer, C., and Holdmann, G., 2011, Potential of Airborne Remote Sensing for Geothermal Resource Exploration: A Case Study of Pilgrim Hot Springs, Alaska. Annual Meeting of the American Association of Petroleum Geologists, May 10-11, Anchorage, Alaska.
- Prakash, A., Nolan, M., Schaefer, K., Haselwimmer, C., and Holdmann, G., 2010, Geothermal Exploration in Pilgrim, Alaska: First Results From Remote Sensing Studies. Eos Trans. AGU 91(52), Fall Meet. Suppl., Abstract no. V13B-2350.
- YEARLY PROGRESS REPORT - December 2011
- YEARLY PROGRESS REPORT - January 2011
- Innovations in Geothermal - July 2010
Click here to visit the PHASE 2 page
Share this page on Facebook!
